Theoretical study of MRI artifacts by dental alloys
- Three-dimensional analyses –
H. Samejima, Y. Tegawa,1 Y. Kinouchi, and M. Akutagawa2
1
2 Institute of Technology and Science,
Introduction
The metal artifact of MRI by dental alloys is one of the significant problems in clinical practice. A number of clinical and phantom studies have been performed to evaluate the metal artifact. Meanwhile few theoretical evaluations of the metal artifact are reported. The theoretical evaluation has great flexibility about conditions of imaging, such as structures of (theoretical) phantoms, strength of the static magnetic field, size of the metal and the magnetic gradient etc. The purpose of this study is to clarify the mechanism of the MRI metal artifacts and to evaluate a size of the region that is influenced by small ferromagnetic metal, such as a magnetic keeper. The computer simulations are performed to obtain the images.
Method
1. Magnetic dipole magnetic
A ferromagnetic metal is magnetized in external magnetic field. From this characteristic, the metal distorts the magnetic field in a gantry of a MRI apparatus. The finite element method is one of familiar method to calculate magnetic field around magnets or metals. But modification of a finite element model is necessary to calculate for various conditions, such as to change the size and position of the metal. In this study, a magnetic dipole model is used to calculate the magnetic field. Precision of this approximation is sufficient except adjacent area of the metal or magnet1). This modeling allows using flexible configuration of the metal and fast calculation time.
Assume a small ferromagnetic metal of volume V is placed in static magnetic field B0. The metal is can be assumed as a magnetic dipole of magnetic moment m = VB0. Direction of the magnetic moment is same as the static magnetic field. Magnetic field Bdp(r) at position r by the magnetic dipole is expressed as,
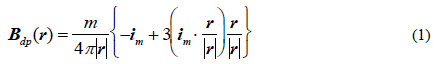
where im is a unit directional vector of the magnetic moment.
1. Simulation of MRI scan
A characteristic of the metal artifact depends on sequences of MRI scan. The spin echo sequence is used in this study. Parameter of TE and TR does not consider in order to simplify the calculation.
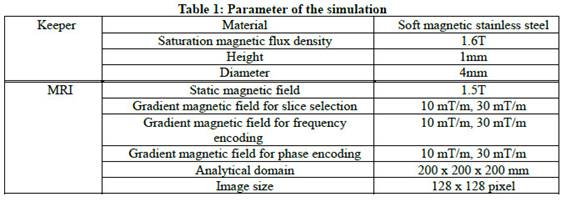
We examined the artifact by changing strength of the static magnetic field, the gradient magnetic field and keeper volume. Table 1 shows the condition of our simulation.
1.1 Artifact in the slice selection
The first step of MRI scan is to activate the signal of the specific z position. This operation is carried out by changing the Lamor frequency for each z-position. Magnitude of the static magnetic field along the z-axis is gradually changed to control the Lamor frequency. When the magnetized metal is in the MRI gantry, magnetic field in arbitrary position is represented as sum of the original magnetic field and that by the metal. Although the magnitude of the magnetic field is proportional to z-position in normal situation, this relation is broken. Relation of the z-position in a reconstructed image and original z-position is represented as
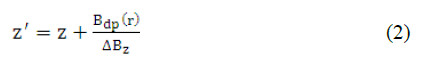
where z is original z-position, z’ is z-position in reconstructed image, DBz is a gradient of slice selection magnetic field, Bdp(r) is magnetic flux density by the magnetic dipole at the position of distance r, where described as Eq (1). In the other word, Eq (2) also represents the geometric distortion in the slice selection. By this distortion, the selected (in the other word ``activated’’) surface is warped into very complex shape, especially neighborhood of the metal.
2. Frequency and phase encoding
The following step is to obtain density distribution in xy-surface (transversal surface). This procedure is called as frequency (or phase) encoding. It is carried out in the activated surface. Although received signals in this step comes from flat surface in normal situation, the signal comes from different z-position. In addition, gradient magnetic field for x and y direction is influenced by the metal.
Received signal without the metal is described as
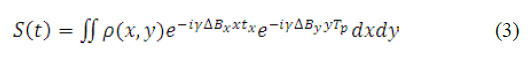
In the other hand, received signal with the metal is described as
Where r(x, y) is the spin density of position (x, y) and g is nucleus gyro magnetic ratio.
Bx is gradient magnetic field for frequency encoding. By is gradient magnetic field for phase encoding. Tp is time to impress of By.
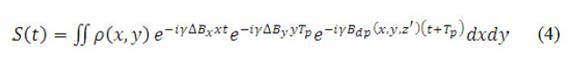
Equation (4) is different in the frequency of the received signal in comparison with the numerical equation (3) because of Bdp(x, y, z’).
The image in transversal surface is obtained by the 2D inverse Fourier transformation. This frequency and phase encoding receives the spin density and the magnetic flux density from the place that activated by slice selection.
Result
1. Distortion of the slice selection
Figure 1 shows the geometric distortion of the slice surface.
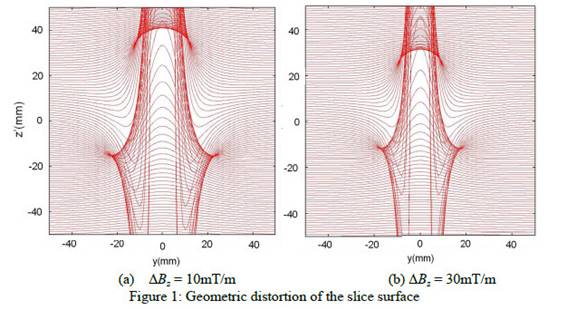
The slice includes the signal of different z-positions. And it shows complicated
distortion. The range of the distortion is smaller (b) than (a).
2. frequency and phase encoding
Figure 2 shows the reconstructed image for a grid pattern.
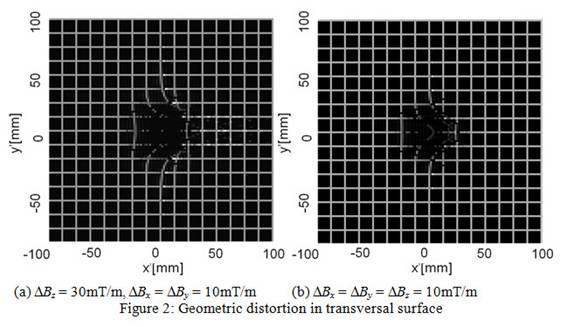
The range of the distortion is smaller (b) than (a).
Discussion and Conclusion
The result of this study shows a tendency similar to that in other clinical studies2 and confirms that this study method is applicable. As results of computer simulation, we confirmed the range of the artifact is depending on the gradient of magnetic field in slice selection and frequency / phase encoding. The larger gradient shows the smaller range of artifact.
This method is easy to consider about the relationship between the artifact and various conditions of imaging. Nevertheless it is important to confirm the simulated result using practical MRI apparatus.
Relationship between
range of distortion and shape or size of the magnetic
keepers is one of the interested problems. Described simulation method is
expected to applied to these problems. It is well-known
that the different tendency is observed using the other MRI sequence. The
examination for them is necessary.
References
1. Takeyama S, Electric magnetic
phenomenon theory, 271-277 and 301-304
2. Iimuro FT, Magnetic Resonance Imaging Artifacts and the Magnetic Attachment System, Dent Mater J 13(1): 76-88, 1994.